Equalizer
Visualisierung
Auf E-Paper am Schreibtisch
Idee
Die Idee ist, mittels eines E-Paper Bildschirms jederzeit zu sehen, welche Equalizer gerade von meinem PC auf das ausgegebene Audio angewendet werden. So kann je nach Nutzung (Videoschnitt, Musik, Filme, etc.) schnell der korrekte Equalizer hinzu- oder weggeschaltet werden.
Das erleichtert die Nutzung und verhindert ein versehentliches Umschalten von Equalizern, die bereits im gewünschten Status verweilten.
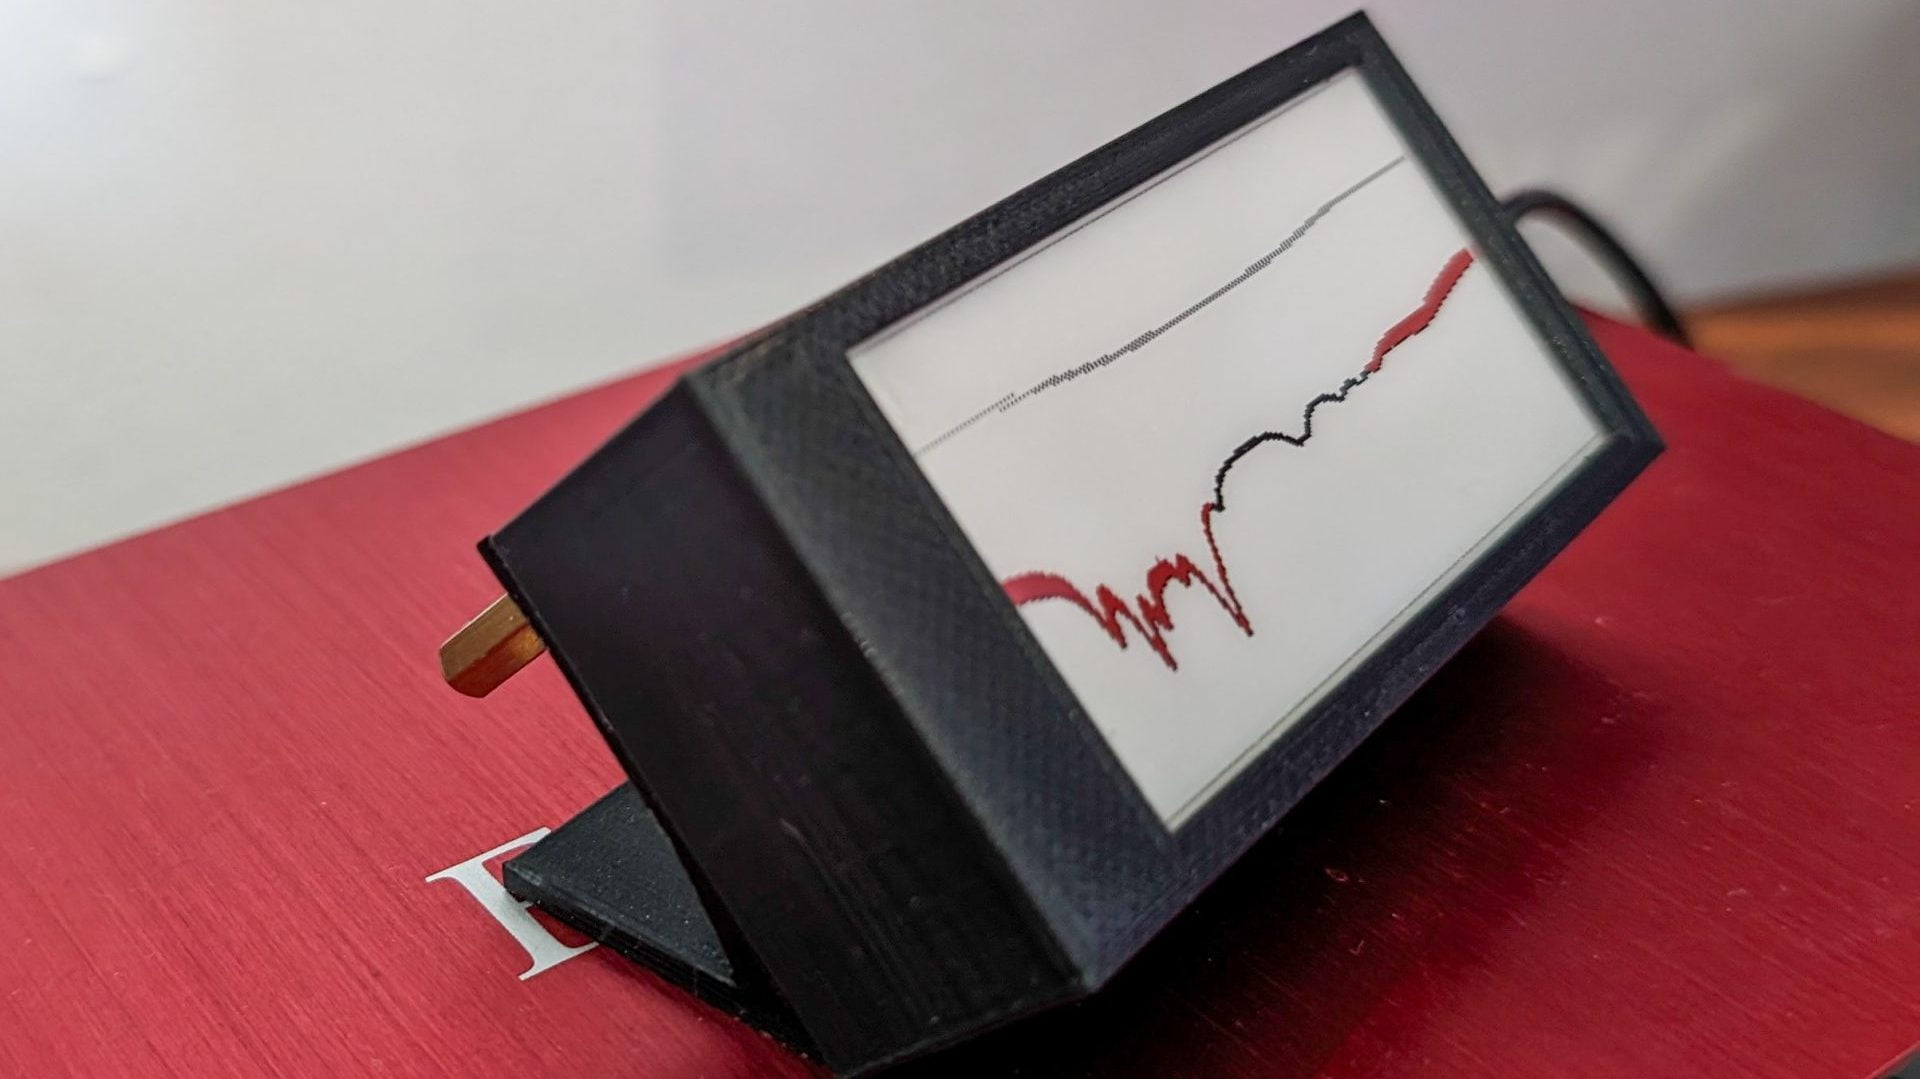
Ziel ist es, auf einem zweifarbigen E-Ink-Screen den aktuellen gesamt EQ als Linie anzuzeigen und die Änderung zum neutralen EQ mit Farbe zu füllen.
Konzept
Für das Steuern der Audioausgabe wird Equalizer APO verwendet. Dieses Programm bietet die Möglichkeit, unterschiedliche parametrische und grafische Equalizer auf den gesamten Audiostream des PCs anzuwenden. Auch das einbetten von Raummodenkorrekturen, wie sei beispielsweise REW erstellt, ist möglich.
Um den Equalizer abhängig von der Arbeit oder dem konsumierten Medium per Knopfdruck zu ändern, wird ein USB-Midi-Controller von Akai genutzt, der über das Programm MIDI-Mixer fensterlose Python-Skripte (.pyw) auslöst.
Diese Python-Skripte durchsuchen die Config-Datei (config.txt) des Equalizers mittels Regex nach der Zeile mit dem entsprechenden EQ und prüft, ob dieser aktiv oder inaktiv ist. Anschließend wird diese Zeile im Toggle-Verhalten deaktiviert oder aktiviert. Zusätzlich wird die ausgeführte Aktion als Windows-Benachrichtigung ausgegeben.
Das funktioniert auch ohne einen Bildschirm, der den aktuellen EQ-Status anzeigt. Doch kommt es oft vor, dass der entsprechende EQ bereits gesetzt war und so die Taste am MIDI-Controller erneut betätigt werden muss, um die Aktion rückgängig zu machen. Da fiel mir ein zweifarbiger E-ink-Screen auf, der als Hat auf einen Raspberry Pi Pico aufgesteckt werden kann.
| # Raummoden Ausgleichender EQ erstellt mit REW und Messung | |
| Include: 17.01.24 20-20000 9db_max_boost.txt | |
| # PA-EQ | |
| # GraphicEQ: 19 6.5; 25 6.2; 31.4 5.2; 40 4.6; 50 4.4; 63 3.1; 80 1.5; 100 0; 125 0; 160 0; 200 0; 249.7 0; 315 0; 400 0; 500 0; 630 0; 800 0; 1000 0; 1250 1; 1600 1; 2000 1; 2500 1; 3150 1; 4000 1; 5000 2; 6300 2; 7976.5 2.6; 10000 2.8; 12500 3; 16000 3.3; 19999 3.5 | |
| # LowShelf | |
| # Filter: ON LSC Fc 161.08 Hz Gain 4.5 dB Q 0.6694 | |
| # HighShelf | |
| # Filter: ON HSC Fc 4920.74 Hz Gain 1 dB Q 0.6706 | |
| # LernHighCut | |
| # Filter: ON HSC Fc 700 Hz Gain -2.2 dB Q 0.6703 | |
| # BassReduction | |
| # Filter: ON LSC Fc 110.17 Hz Gain -2.3 dB Q 0.6706 | |
| # Harman Listening Curve: | |
| GraphicEQ: 31.5 6; 40 5.9; 50 5.5; 63 4.9; 80 3.7; 100 2.5; 125 1.3; 160 0.6; 200 0.2; 250 0; 1000 -1; 32000 -3 |
| from win10toast import ToastNotifier | |
| import regex as re | |
| from time import sleep | |
| import graph_gen | |
| # Initialize variables | |
| announced = False | |
| notification = "" | |
| search_pat = re.compile(r"#\sLowShelf") | |
| # Create ToastNotifier object | |
| toast = ToastNotifier() | |
| # Open configuration file | |
| with open("C:/Program Files/EqualizerAPO/config/config.txt", "r+") as conf: | |
| conf_text = conf.read().splitlines() | |
| # Iterate through lines in the config file | |
| for i, line in enumerate(conf_text): | |
| # Check if previously announced | |
| if announced: | |
| # Enable or disable bass boost based on comment | |
| if line[0] == "#": | |
| conf_text[i] = line[1:].strip() | |
| notification = "Enabled Bass-Boost ¯¯¯¯\_______" | |
| else: | |
| conf_text[i] = "# " + line.strip() | |
| notification = "Disabled Bass-Boost ----------------" | |
| # Reset announced flag | |
| announced = False | |
| break | |
| # Check for matching filter pattern | |
| if search_pat.match(line): | |
| announced = True | |
| # Write modified configuration back to file | |
| if notification != "": | |
| conf.seek(0) | |
| conf.truncate(0) | |
| conf.write("\n".join(conf_text)) | |
| else: | |
| notification = "Filter not found!" | |
| # Display toast notification | |
| toast.show_toast( | |
| "Equalizer", | |
| notification, | |
| duration=3, | |
| icon_path="C:/Users/Leo/AppData/Roaming/midi-mixer-app/eq.ico", | |
| threaded=True) | |
| # Generate graph | |
| graph_gen.main() | |
| # Wait until notification is finished | |
| while toast.notification_active(): | |
| sleep(0.1) |
Im Python-Skript werden zunächst die Module für die Windows Benachrichtigungen und Regex geladen.
Nach öffnen der config.txt wird durch die Linien iteriert, bis der Reguläre Ausdruck für den Titel des Bass-Boosts („#LowShelf“) matched. Die darauffolgende Zeile muss dementsprechend der Filter sein.
Anschließend wird geprüft, ob der Filter deaktiviert (mit #) oder aktiviert (ohne #) ist. Als nächstes wird die Zeile so manipuliert, dass sie jeweils zum gegenteiligen geändert wird.
Jetzt wird eine Windows Toast Benachrichtigung ausgegeben, welche die getätigte Änderung mitteilt.
Materialien
Elektronik
Werkzeug
- 3D-Drucker + Filament
Gehäuse
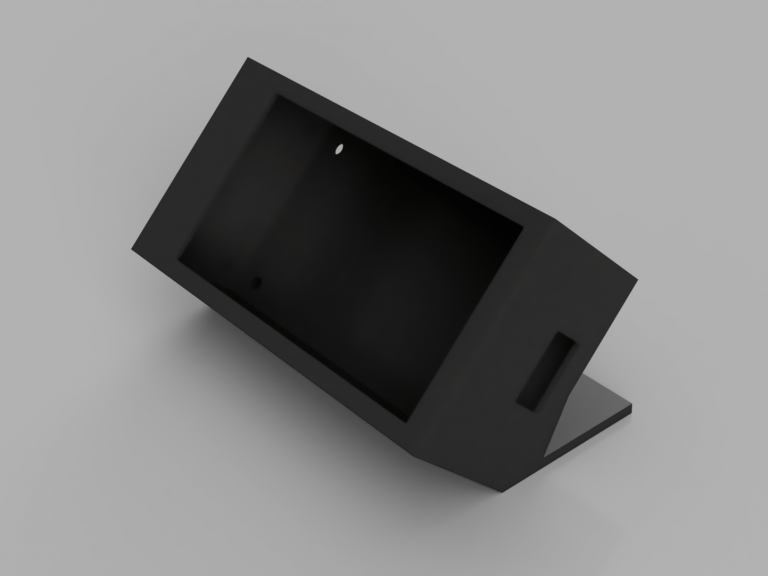
Ich habe mich entschieden, ein 3D-gedrucktes Gehäuse für den Prototyp zu verwenden. Leider ist es nicht wirklich ästhetisch, aber sehr flexibel in der Gestaltung und Verwendung.
Für die Zukunft ist jedoch ein Holzgehäuse geplant.
Die Dateien sind beigefügt, hier gibt es nichts Besonderes zu beachten. Das Design ist so einfach, dass ich es mit 0,26 mm Schichtdicke gedruckt habe, um schneller fertig zu werden.
Für eine einfache Nachbearbeitung können die Stützstrukturen aktiviert werden, um den Kabeleingang zu stützen.
Software
Um das Ziel der grafischen Darstellung zu erreichen werden die einzelnen Python-Skripte um ein selbstgeschriebenes Modul ergänzt. Innerhalb dieses Moduls werden alle aktiven Equalizer eingelesen, mathematisch auf eine Null-Matrix angewendet und diese Matrix anschließend als Equalizer-Graph in der entsprechenden Auflösung geplottet. Für eine Überhöhung zum flachen EQ (mit Raumkorrektur) wird die Fläche dazwischen rot gefüllt. Verringert der EQ die Lautstärke zum flachen EQ, wird der Bereich grau gefüllt. Beim E-Paper entspricht das durch Dithering einer Schachbrett Musterung.
Der Rendervorgang muss für das E-Paper Display in zwei Einzelbilder zerlegt werden. Einmal für die roten und einmal für die schwarzen Pixel. Beide Bilder werden für eine simple serielle Übertragung in eindimensionalen Arrays mit einem Bit Farbtiefe (also Schwarz / Weiß) abgelegt und anschließen über den festgelegten Port gesendet.
| import serial | |
| import numpy as np | |
| import regex as re | |
| import audio_dspy as adsp | |
| import matplotlib.pyplot as plt | |
| from io import BytesIO | |
| from pathlib import Path | |
| from scipy import signal | |
| from PIL import ImageChops, Image as im | |
| from time import sleep | |
| #TODO: Threading for read / write / serial | |
| #============================================================================== | |
| EQAPO = Path('C:\\Program Files\\EqualizerAPO\\config\\config.txt') | |
| REW = Path('C:\\Program Files\\EqualizerAPO\\config\\17.01.24 20-20000 9db_max_boost.txt') | |
| USE_EPAPER = True | |
| COMPORT = 'COM8' | |
| NBINS = 65536 | |
| FSAMPLE = 44100 | |
| #============================================================================== | |
| rew_regex = r"Filter\s+([0-9]+):\s(?P<state>\w+)\s+(?P<type>\w+)\s+Fc\s+(?P<freq>\d+.\d+)\sHz\s+Gain\s+(?P<gain>-?\d+.\d+)\sdB\s+Q\s+(?P<qfactor>\d+.\d+)\n" | |
| rew_pat = re.compile(rew_regex) | |
| eq_apo_regex = r"(?P<is_disabled>#?)\s?(?P<type>\w+):\s(?P<payload>[^\n]+)" | |
| eq_apo_pat = re.compile(eq_apo_regex) | |
| def read_rew_file(file): | |
| """Reads the Room EQ Wizard file and returns a list of dicts with the filter parameters. | |
| Args: | |
| file (str / path): Path to the Room EQ Wizard file. | |
| Returns: | |
| Combined frequency response of all REW filters in the file. | |
| x axis ticks for the frequency response. | |
| """ | |
| # read the room correction filter | |
| filterlist = [] | |
| with open(file, 'r') as f: | |
| line = f.readline() | |
| while line: | |
| m = re.match(rew_pat, line) | |
| if m: | |
| filterlist.append(m.groupdict()) | |
| line = f.readline() | |
| # read the applied eq filters | |
| responselist = [] | |
| # later combine with top loop | |
| for filter in filterlist: | |
| if filter['type'] == 'PK': | |
| #b,a = adsp.design_bell(float(filter['freq']), 1, float(filter['qfactor']), fs=FSAMPLE) | |
| b,a = signal.iirpeak(float(filter['freq']), float(filter['qfactor']), fs=FSAMPLE) | |
| w,h = signal.freqz(b, a, worN = NBINS ,fs=FSAMPLE) | |
| responselist.append((w,h,float(filter['gain']))) | |
| freq_ticks = w # frequency ticks of last filter (should be the same for all filters) | |
| room_corr_curve = np.zeros(NBINS) # initialize room correction curve | |
| for response in responselist: | |
| room_corr_curve += abs(response[1]) * response[2] | |
| return room_corr_curve, freq_ticks | |
| def read_applied_eqs(path, freq_ticks): | |
| """Reads Equalizer APO config file and returns the added up frequency response of all EQs. | |
| Args: | |
| path (str / path): path to Equalizer APO config file. | |
| Returns: | |
| Frequency response of all EQs in the config file. | |
| x axis ticks for the frequency response (same as for the REW curve) | |
| """ | |
| eq_list = [] | |
| with open(path, 'r') as f: | |
| line = f.readline() | |
| while line: | |
| m = re.match(eq_apo_pat, line) | |
| if m and m.group('is_disabled') != '#': | |
| eq_list.append(m.groupdict()) | |
| line = f.readline() | |
| all_eq_comb = np.zeros(NBINS) | |
| for eq in eq_list: | |
| eq_f_gain_pairs = [] | |
| eq_freq, eq_gain = [], [] | |
| if eq['type'] == 'GraphicEQ': | |
| eq_f_gain_pairs = map(str.strip, eq['payload'].split(';')) # split at semicolon | |
| eq_f_gain_pairs = map(str.split, eq_f_gain_pairs) # strip whitespaces | |
| #eq_curve = map(lambda x: (float(x[0]), float(x[1])), eq_curve) # convert to float | |
| for pair in eq_f_gain_pairs: eq_freq.append(float(pair[0])); eq_gain.append(float(pair[1])) | |
| eq_response = np.array(np.interp(freq_ticks, eq_freq, eq_gain) ) | |
| all_eq_comb += eq_response | |
| elif eq['type'] == 'Filter': | |
| m = re.match(r"ON\s(?P<type>\w+)\s(?:(?P<steilheit>\d+)\sdB\s)?Fc\s(?P<freq>[\d\.]+)\sHz(?:\sGain\s(?P<gain>[\-\d\.]+)\s)?(?:dB\s)?(?:Q\s(?P<qfactor>[\-\d\.]+))?", eq['payload']) | |
| if m: | |
| typ = m.group('type') | |
| freq = float(m.group('freq')) | |
| gain = abs(float(m.group('gain'))) if m.group('gain') else None | |
| is_negative = True if m.group('gain') is not None and m.group('gain').startswith('-') else False | |
| q_factor = float(m.group('qfactor')) if m.group('qfactor') else 0.7 | |
| # maybe switch case | |
| if typ in ['LSC', 'LS']: # low shelf | |
| if is_negative: | |
| #b,a = adsp.design_high_low_shelf(gain+10,10, freq, FSAMPLE) | |
| #b,a = adsp.design_lowshelf(freq, q_factor, gain+1, FSAMPLE) | |
| b,a = adsp.design_highshelf(freq, q_factor, gain+1, FSAMPLE) | |
| w,h = signal.freqz(b, a, worN = NBINS ,fs=FSAMPLE) | |
| #eq_response = (abs(h)*-1+1) | |
| eq_response = abs(h)-gain-1 | |
| else: | |
| #b,a = adsp.design_high_low_shelf(gain+1,1, freq, FSAMPLE) | |
| b,a = adsp.design_lowshelf(freq, q_factor, gain+1, FSAMPLE) | |
| w,h = signal.freqz(b, a, worN = NBINS ,fs=FSAMPLE) | |
| eq_response = abs(h)-1 | |
| elif typ in ['HS', 'HSC', 'LP', 'LPQ']: # high shelf | |
| if typ in ['LP', 'LPQ']: | |
| gain = 50 | |
| is_negative = True | |
| if is_negative: | |
| b,a = adsp.design_lowshelf(freq, q_factor, gain+1, FSAMPLE) | |
| w,h = signal.freqz(b, a, worN = NBINS ,fs=FSAMPLE) | |
| eq_response = abs(h)-gain-1 | |
| else: | |
| b,a = adsp.design_highshelf(freq, q_factor, gain+1, FSAMPLE) | |
| w,h = signal.freqz(b, a, worN = NBINS ,fs=FSAMPLE) | |
| #eq_response = (abs(h)*-1+1) | |
| eq_response = abs(h)-1 | |
| if eq_response is not None: | |
| all_eq_comb += eq_response # superposition of all eqs | |
| return all_eq_comb | |
| def create_bitmaps(freq_ticks, rew_curve, eq_curve): | |
| eqed_room_corr = rew_curve + eq_curve | |
| # Plot | |
| DPI = 100 | |
| fig_black = plt.figure(figsize=(296/DPI*296/229, 152/DPI*152/117), dpi = DPI) #Pixel/DPI -> inches | multiplication is bbox_inches='tight' workaround | |
| ax1 = fig_black.add_subplot(1, 1, 1) | |
| ax1.set_xscale('log') | |
| ax1.plot(freq_ticks, rew_curve-5, color='black', linewidth=1.0, linestyle='-', antialiased=False) | |
| ax1.plot(freq_ticks, eq_curve+15, color='gray', linewidth=1.0, linestyle='-', antialiased=False) | |
| #ax1.plot(freq_interval, combined*0.7, color='red', linewidth=1.0, linestyle='-', antialiased=False) | |
| ax1.fill_between(freq_ticks, rew_curve-5, eqed_room_corr-5, where=eqed_room_corr-5 <= rew_curve-0.5-5, facecolor='gray', antialiased=False) | |
| ax1.set_axis_off() | |
| ax1.margins(0, 0, tight=True) | |
| ax1.set_ylim([-30, 30]) | |
| ax1.set_xlim([20, 20000]) | |
| fig_red = plt.figure(figsize=(296/DPI*296/229, 152/DPI*152/117), dpi = DPI) | |
| ax2 = fig_red.add_subplot(1, 1, 1) | |
| ax2.set_xscale('log') | |
| ax2.margins(0, 0, tight=True) | |
| ax2.set_ylim([-30, 30]) | |
| ax2.set_xlim([20, 20000]) | |
| ax2.set_axis_off() | |
| ax2.fill_between(freq_ticks, rew_curve-5, eqed_room_corr-5, where=eqed_room_corr-5 >= rew_curve+0.5-5, facecolor='black', antialiased=False) #facecolor black but its the red bitmap, -5 for screen offset to bottom | |
| #ax2.fill_between(freq_ticks, room_corr_curve, eqed_room_corr, where=eqed_room_corr < room_corr_curve-0.5, facecolor='black', antialiased=False) | |
| # bytearray conversion | |
| buf = BytesIO() | |
| # save png to buffer | |
| fig_black.savefig(buf, format = "png", dpi=100, bbox_inches='tight', pad_inches=0.0) | |
| # open png image from buffer, convert to 1 byte depth | |
| buf.seek(0) | |
| image = im.open(buf).convert('1') | |
| image = image.rotate(90, expand = 1) | |
| black_bytes = np.array(image).tobytes() | |
| buf.truncate(0) | |
| buf.seek(0) | |
| fig_red.savefig(buf, format = "png", dpi=100, bbox_inches='tight', pad_inches=0.0) | |
| buf.seek(0) | |
| image = im.open(buf).convert('1') | |
| ImageChops.offset(image, 0, -3) | |
| image = image.rotate(90, expand = 1) | |
| red_bytes = np.array(image).tobytes() | |
| red_one_bit = [] | |
| black_one_bit = [] | |
| for i in range(0, len(black_bytes), 8): | |
| bin_list = [1 if x else 0 for x in black_bytes[i:i+8]] | |
| val = int(''.join(map(str, bin_list)), 2) | |
| black_one_bit.append(val) | |
| for i in range(0, len(red_bytes), 8): | |
| bin_list = [1 if x else 0 for x in red_bytes[i:i+8]] | |
| val = int(''.join(map(str, bin_list)), 2) | |
| red_one_bit.append(val) | |
| return black_one_bit, red_one_bit | |
| def send_data(ser, bytes_black, bytes_red): | |
| """data_reworked_black = [] | |
| data_reworked_red = [] | |
| for b in bytes_black: | |
| if b == 0xff: | |
| data_reworked_black.append(0xfe) | |
| else: | |
| data_reworked_black.append(b) | |
| for b in bytes_red: | |
| if b == 0xff: | |
| data_reworked_red.append(0xfe) | |
| else: | |
| data_reworked_red.append(b)""" | |
| #ser = serial.Serial(ser, 115200, timeout=1) | |
| ser.write(bytes_black + [0,0,0,0,0,0] + bytes_red + [0,0,0,0,0,0]) | |
| #ser.write(bytes_red + [0,0,0,0,0,0]) | |
| #read serial answewr until there is no more data | |
| x = b'1' | |
| while x != b'': | |
| x = ser.read() | |
| print(x) | |
| #close serial | |
| ser.flush() | |
| def main(): | |
| if USE_EPAPER: | |
| ser = serial.Serial(COMPORT, 115200, timeout=1, write_timeout=1,inter_byte_timeout=0.1) | |
| if not ser.isOpen(): | |
| ser.open() | |
| room_rew_corr, freq_ticks = read_rew_file(REW) | |
| all_eq_comb = read_applied_eqs(EQAPO, freq_ticks) | |
| black, red = create_bitmaps(freq_ticks, room_rew_corr, all_eq_comb) | |
| send_data(ser, black, red) | |
| ser.flush() | |
| ser.close() | |
| if __name__ == '__main__': | |
| #ser = serial.Serial(COMPORT, 115200, timeout=1) | |
| #ser.open() | |
| main() |
Auf der anderen Seite steht der Raspberry Pi Nano. Dieser enthält in C geschriebenen Code, um am seriellen Eingang auf die Übertragung der beiden Bitmaps zu warten. Diese werden von Python als Bytearrays übergeben. Da die Unterteilung in schwarze und rote Bitmap auf dem Pi Pico statt findet, werden beide Bytearrays zusammen ausgegeben. Nach erfolgreicher Übertragung werden diese über die Waveshare E-Paper Library an das Display ausgegeben.
Sollte die übertragung nur teilweise oder fehlerhaft erfolgen, resettet sich der Pico und fällt zurück in eine auf serielle Daten wartende Schleife. Als keepalive-heartbeat wird die eingebaute LED nach jedem loop getoggled.
| #include "DEV_Config.h" | |
| #include "GUI_Paint.h" | |
| #include "./lib/e-Paper/EPD_2in66b.h" | |
| #include <stdlib.h> // malloc() free() | |
| #include <stdio.h> // printf() | |
| // Image Buffers | |
| unsigned char gImage_b[5630]; | |
| unsigned char gImage_r[5630]; | |
| int main(void) | |
| { | |
| // GPIO setup | |
| stdio_init_all(); | |
| gpio_init(25); | |
| gpio_set_dir(25, GPIO_OUT); | |
| gpio_put(25, 0); | |
| // Initialize EPD and allocate memory for image buffers | |
| if (DEV_Module_Init() != 0) | |
| { | |
| return -1; | |
| } | |
| EPD_2IN66B_Init(); | |
| EPD_2IN66B_Clear(); | |
| // Create new image cache for black and red images | |
| UBYTE *BlackImage, *RedImage; | |
| UWORD Imagesize = ((EPD_2IN66B_WIDTH % 8 == 0) ? (EPD_2IN66B_WIDTH / 8) : (EPD_2IN66B_WIDTH / 8 + 1)) * EPD_2IN66B_HEIGHT; | |
| if ((BlackImage = (UBYTE *)malloc(Imagesize)) == NULL || (RedImage = (UBYTE *)malloc(Imagesize)) == NULL) | |
| { | |
| printf("Failed to apply for memory...\r\n"); | |
| return -1; | |
| } | |
| Paint_NewImage(BlackImage, EPD_2IN66B_WIDTH, EPD_2IN66B_HEIGHT, 270, WHITE); | |
| Paint_Clear(WHITE); | |
| Paint_NewImage(RedImage, EPD_2IN66B_WIDTH, EPD_2IN66B_HEIGHT, 270, WHITE); | |
| Paint_Clear(WHITE); | |
| EPD_2IN66B_Sleep(); | |
| DEV_Delay_ms(2000); // Important delay, at least 2s | |
| // Main loop | |
| int i = 0; | |
| char color = 'b'; // Variable to track current color buffer (black or red) | |
| while (1) | |
| { | |
| // Toggle GPIO pin to indicate activity | |
| gpio_put(25, !gpio_get(25)); | |
| // Read incoming data | |
| int c = getchar_timeout_us(500000); | |
| // If there's incoming data and buffer index is within limits | |
| if (i < 5630 && c != PICO_ERROR_TIMEOUT) | |
| { | |
| // Store data in appropriate buffer (black or red) | |
| if (color == 'b') | |
| { | |
| gImage_b[i] = c; | |
| } | |
| else if (color == 'r') | |
| { | |
| gImage_r[i] = c; | |
| } | |
| i++; | |
| // If black image buffer is filled, switch to red buffer | |
| if (i == 5630 && color == 'b') | |
| { | |
| color = 'r'; | |
| i = 0; | |
| } | |
| // If red image buffer is filled, proceed to display | |
| else if (i == 5630 && color == 'r') | |
| { | |
| printf("Printing to screen!\r\n"); | |
| // Initialize EPD and clear screen (best practice) | |
| EPD_2IN66B_Init(); | |
| // EPD_2IN66B_Clear(); | |
| DEV_Delay_ms(200); | |
| // Display black and red images | |
| Paint_SelectImage(BlackImage); | |
| Paint_Clear(WHITE); | |
| Paint_DrawBitMap(gImage_b); | |
| Paint_SelectImage(RedImage); | |
| Paint_Clear(WHITE); | |
| Paint_DrawBitMap(gImage_r); | |
| EPD_2IN66B_Display(BlackImage, RedImage); | |
| DEV_Delay_ms(3000); | |
| // Enter sleep mode | |
| EPD_2IN66B_Sleep(); | |
| // Reset color and index for next cycle | |
| color = 'b'; | |
| i = 0; | |
| } | |
| } | |
| else | |
| { | |
| // Reset color and index on serial timeout | |
| color = 'b'; | |
| i = 0; | |
| } | |
| } | |
| return 0; | |
| } |
Inbetriebnahme
Für die Inbetriebnahme müssen lediglich die EQ-Anpassungsskripte um die Integration des EQ-Plot Moduls erweitert werden:
| import graph_gen | |
| """Other code from previous Example""" | |
| graph_gen.main(ser) |
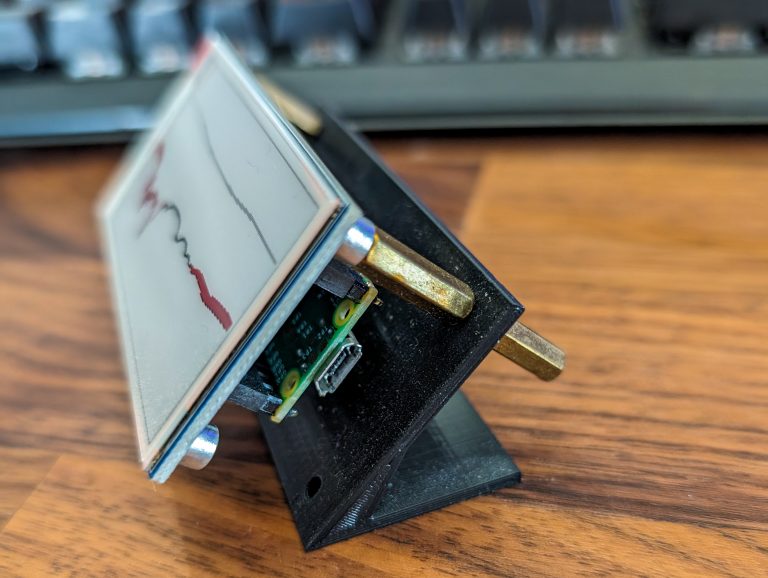
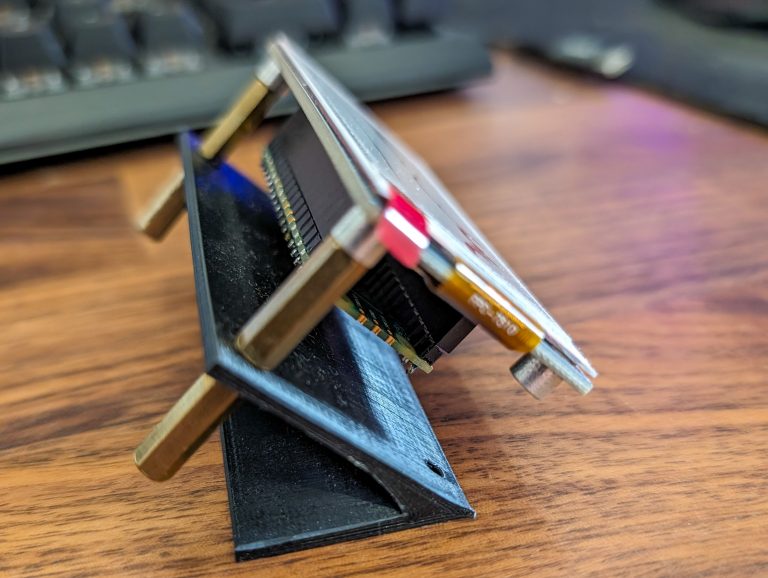
Um die Elektronik in dem Gehäuse zu befestigen werden die mitgelieferten Standoffs genutzt. Alternativ können natürlich auch normale Schrauben der entsprechenden Dicke und Gewindesteigung genutzt werden.
Jetzt sollte alles funktionieren. Sobald per USB-MIDI-Controller ein Teil des Equalizers von Equalizer-APO aktiviert oder deaktiviert wird, wird die Darstellung auf dem E-Ink Display am Schreibtisch automatisch angepasst und ermöglicht einen schnellen Wechsel zwischen unterschiedlichen Einstellungen.